Case studiesReference integration: machine data to a time-series store
Machine telemetry into ClickHouse without loss through an outage
How OpexFlow lands high-volume machine telemetry from JetStream in ClickHouse in batches, what the ClickHouse sink does while the database is down, and the one case where rows can still be lost.
Why the pipe matters more than the database
Telemetry is the one stream a plant produces in volume: every machine, every poll. A column store such as ClickHouse is the right place for it, and it is also the part that gets restarted, upgraded and filled up. If the pipe in front of it drops rows while it is away, the gap shows up months later as a hole in a trend.
JetStream is that pipe. It keeps the messages and delivers them again until the consumer has acknowledged them. What is left to prove is the consumer: that it writes in batches ClickHouse likes, that it stops taking messages when ClickHouse is down instead of buffering without limit, and that it picks up where it left off.
The flow
Four simulated CNC machines publish telemetry.v1 records to opex.v1.telemetry.<machine> in the OPEX_TELEMETRY stream. A record is flat, without an envelope, and carries the machine, the state, the spindle and a timestamp. The publisher sets Nats-Msg-Id so that JetStream itself drops an exact repeat inside five minutes.
Nodes in the telemetry flow
- JetStream: machine
- filter: real readings
- ClickHouse sink, batched
- One source per machine reads its subject. The record is passed through as it was published.
- A filter drops the offline markers that a source emits when a machine has been silent for 60 seconds, so they do not end up as readings.
- The ClickHouse sink collects rows and inserts them in batches of up to 500 rows or one second, with a stable insert_deduplication_token so a repeated batch is recognised.
- The message is acknowledged to JetStream once the sink holds its row.
The sink is told how much it may hold in memory and what to do when that is full. With on_full set to block it refuses new rows, so the source does not acknowledge the message and JetStream keeps it. The table has a single String column that receives the record as it is, and materialised columns that read the machine, the state and the spindle out of it for queries.
clickhouse:
  enabled: true
  url: "http://127.0.0.1:18123"
  database: "opex"
  sink_table: "telemetry"
  sink_batch:
    sink_batch_rows: 500
    sink_batch_interval_ms: 1000
    max_backlog_rows: 2000   # rows held in memory while ClickHouse is away
on_full: block # refuse rows, so JetStream keeps the messagesCREATE TABLE opex.telemetry
(
raw String,
ts DateTime64(3, 'UTC') MATERIALIZED parseDateTime64BestEffort(JSONExtractString(raw, 'timestamp'), 3, 'UTC'),
machine_id LowCardinality(String) MATERIALIZED JSONExtractString(raw, 'machine', 'id'),
state LowCardinality(String) MATERIALIZED JSONExtractString(raw, 'status', 'state'),
spindle_speed Float64 MATERIALIZED JSONExtractFloat(raw, 'spindle', 'speed')
)
ENGINE = MergeTree
PARTITION BY toYYYYMM(ts)
ORDER BY (machine_id, ts)
SETTINGS non_replicated_deduplication_window = 1000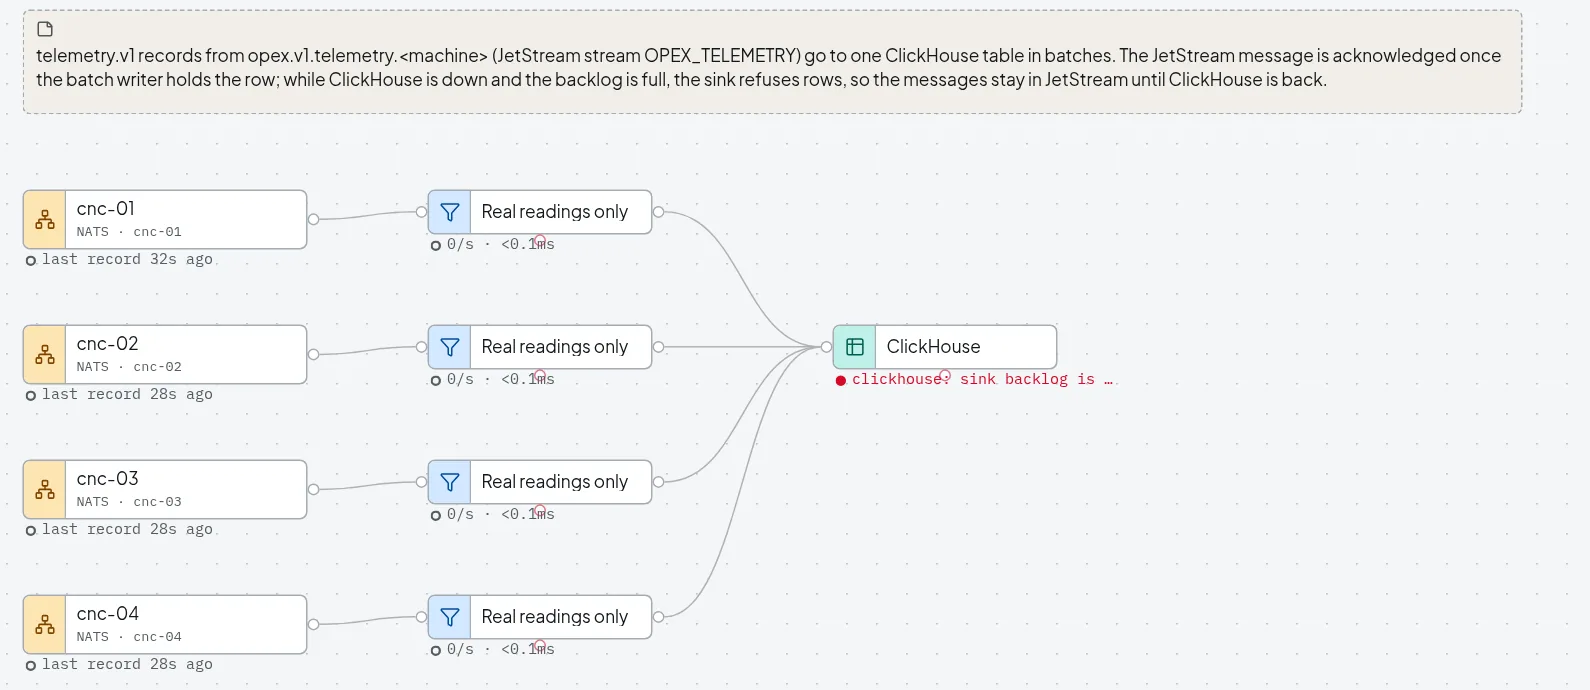
Normal volume
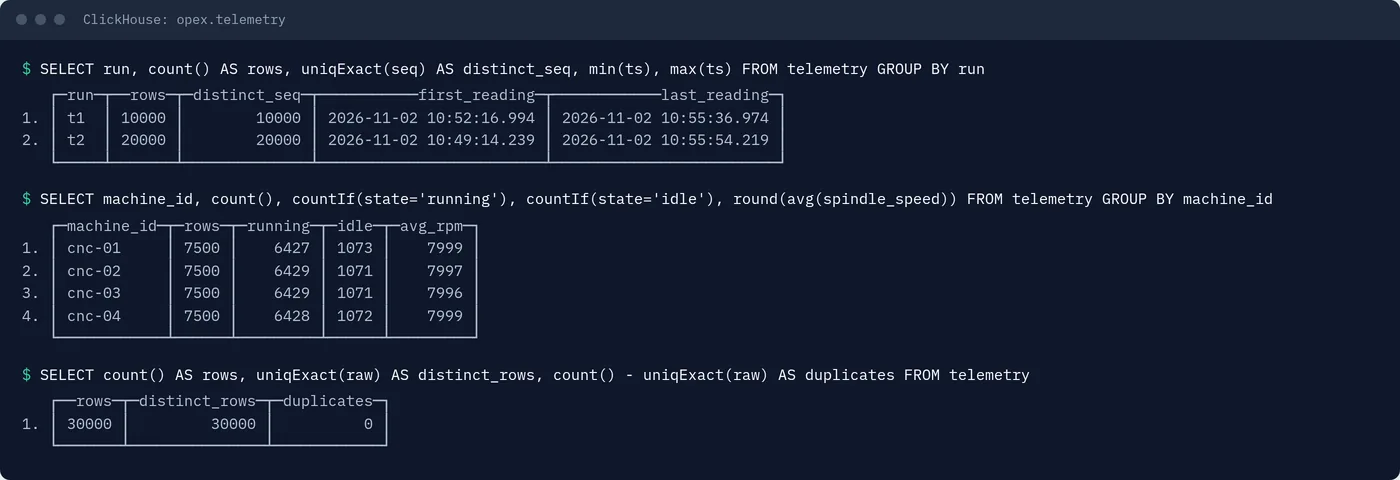
The first test published 10,000 records at once, spread over the four machines, in 3.45 seconds (about 2,900 a second). Within a few seconds of the last publish the table held 10,000 rows with 10,000 distinct sequence numbers, and the OpexFlow consumer showed no pending and no unacknowledged messages. Each record carries a run label and a sequence number in its metadata, so the count is a check of identity, not only of quantity.
ClickHouse stopped for 93 seconds
The second test stopped the ClickHouse container, published 20,000 records in 6.7 seconds, left ClickHouse down for 93 seconds and started it again. The numbers below are read from the NATS monitoring endpoint, from the OpexFlow status and from ClickHouse.
| Seconds | ClickHouse | Held in the sink | Unacknowledged in JetStream | Not yet delivered | Rows of this run in ClickHouse |
|---|---|---|---|---|---|
| 5 | stopped | 0 | 0 | 0 | down |
| 22 to 93 | down | 2,000 (the limit) | 14,336 (the consumer limit) | 3,664 | down |
| 98 | started 5 s ago | 0 | 14,336 | 3,664 | 2,000 |
| 139 | up | 0 | 3,186 | 0 | 18,429 |
| 144 | up | 0 | 5 | 0 | 19,995 |
| 200 | up | 0 | 0 | 0 | 20,000 |
While ClickHouse was down the sink held 2,000 rows, its limit. The consumer then held 14,336 messages unacknowledged, which is its limit too, and JetStream kept the remaining 3,664. The three numbers add up to the 20,000 published. Nothing was dropped and the publisher was not slowed. When ClickHouse came back the 2,000 held rows were written within five seconds, and the redelivered messages followed. The last five waited out the longest redelivery delay of 60 seconds, so the full drain took 107 seconds. An earlier run of the same test drained in about 50 seconds.
The result is read in the database, not from the counters. The table held 30,000 rows for 30,000 published, every run label with the exact number of distinct sequence numbers, and no row appeared twice.
The sink status agrees: 30,000 rows published, 879 writes refused while the backlog was full, 0 dropped. Health and SLA shows the refusals as what they are, writes that the flow retried.

The case that can still lose rows
The sink acknowledges a message when it has accepted the row into its memory backlog, not when ClickHouse has stored it. That keeps the pipeline fast, and it means the rows in the backlog exist only in memory. We measured what that costs. With ClickHouse stopped, 1,500 records were published, fewer than the 2,000 the backlog holds, so every one was accepted and acknowledged: JetStream showed nothing pending and nothing unacknowledged. OpexFlow was then stopped and started again, with ClickHouse back up. The table held none of the 1,500.
The messages are still in OPEX_TELEMETRY, which keeps 30 days, but the consumer has acknowledged them and does not receive them again. So the guarantee reads: no loss through a ClickHouse outage while OpexFlow keeps running, and at most max_backlog_rows rows at risk if OpexFlow stops during one. The setting is the knob: a smaller backlog risks fewer rows and starts refusing earlier. This test ran on the same stack before the clean run above, not in it.
Scope
- Simulated machines publish telemetry.v1 records. No machine and no connector was involved. The records were checked against the telemetry.v1 schema before they were published.
- One ClickHouse node on one host. Replication, TTL and the retention policy of the table are set per installation.
- The NATS source rewrites two fields of a passed-through record: machine.id becomes the configured device id (the same here) and source becomes nats, so the producer value, such as focas, is not kept in ClickHouse.
- A message that the sink refuses is retried with a delay that doubles from 2 seconds to 60, so the end of a drain is bounded by 60 seconds, not by ClickHouse.
- OpexFlow 2.2.0 reads device subjects under opexmx.ingest.* from one ingest stream. The contract subjects opex.v1.telemetry.* reach it through a stream that sources OPEX_TELEMETRY and renames the subjects.