Case studiesReference integration: ERP ledger to database
Epicor general ledger to Postgres: one request per partition, checked by count
How a scheduled flow copies the Epicor Kinetic general ledger journal detail into Postgres without silent loss: one request per fiscal year, period and book, a count check that refuses a short partition, an upsert that makes a re-run harmless, retries on 429 and 503, dead letters for 400 and 401, an alert when a pull fails, and a nightly comparison of Epicor and Postgres totals.
Why a ledger pull needs a count check
An Epicor BAQ is a stored query exposed over REST. A general ledger BAQ returns tens of thousands of rows, and the obvious way to copy it is $top and $skip paging. Epicor does not promise a row order for an unordered BAQ, and in probes of a real Epicor test server the rows came back in a different order on every call. Paging then drops some rows and repeats others at the page boundaries, and no request fails. Paging the FY2025 trial balance that way lost 12 of its 17,160 rows.
The pattern that came out of those probes is one request per partition with a count check: ask Epicor how many rows a fiscal year, period and book holds, fetch that partition in a single request, and accept it only if the rows received equal the count. This article builds that pattern as a flow and runs it.
The probes were not repeated here. The mock server that stands in for Epicor keeps a stable row order, so it cannot show the loss. What the test does show is the rest of the flow: a partition that comes back short, Epicor answering 429, 503, 401 or 400, a re-run, and the two sides drifting apart.
What was real, recorded and injected
| Part | What it was |
|---|---|
| Epicor data | Recorded. Responses captured from Epicor Kinetic’s demo company EPIC06 and replayed by epicor-mock, a Cloudflare Worker run locally. 14,207 journal detail rows in fiscal years 2021, 2022, 2024, 2025 and 2026. |
| Epicor behaviour | Copied by the mock from probes of a real server: API key, Basic or Bearer login with an empty 401, Epicor error envelopes, OData $filter, $top, $skip and $count, and $top=0 returning every row. Unlike the real server, its row order is stable. |
| OpexFlow and Postgres | Real. OpexFlow 2.2.0 and Postgres 16 on one machine. Every number below was counted from them. |
| Faults | Injected. 429 and 503 are the mock’s own fault options, switched on per request by a small proxy between OpexFlow and the mock. A missing login and a wrong column name make the mock answer a real 401 and a real 400. The short partition comes from a second mock instance that caps every answer at 1,000 rows. |
| Alert email | Real SMTP delivery to a local test mailbox. |
| Not tested | A live Epicor server, response times at production size, the trial balance BAQ, and the credentials of a real instance. |
The flow
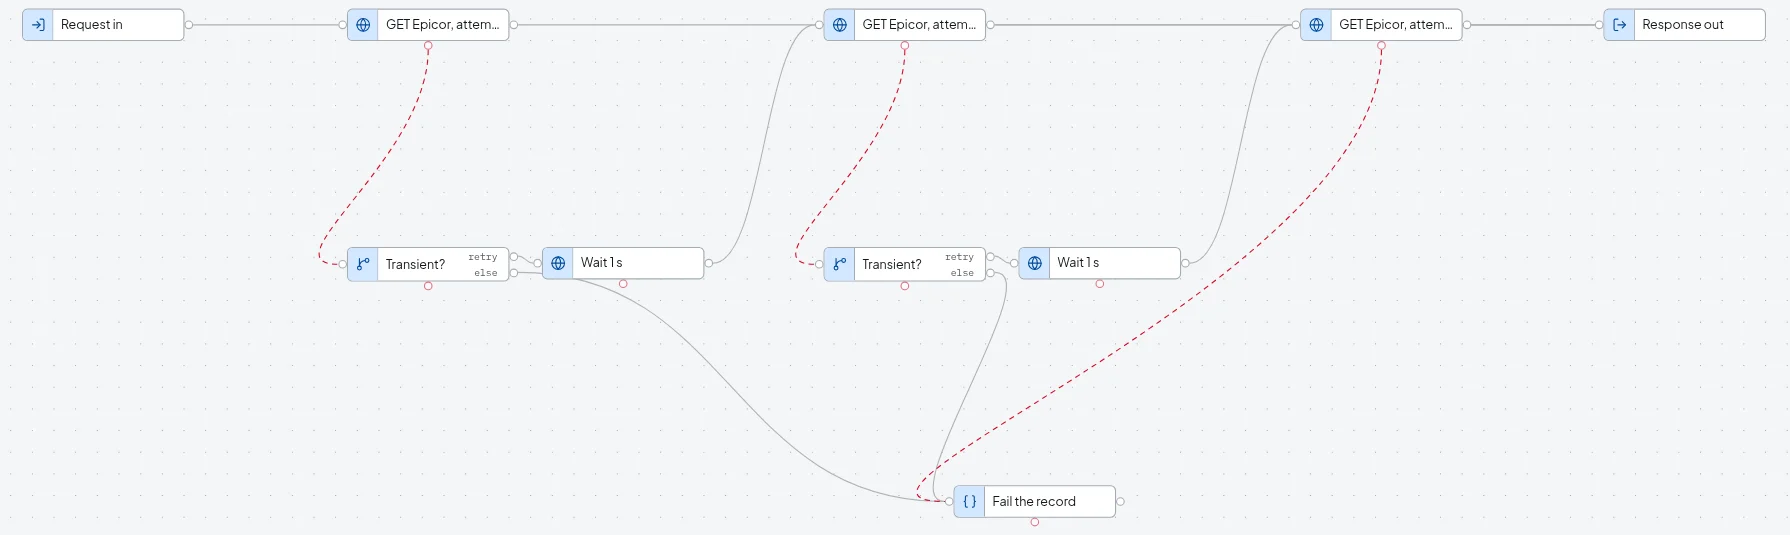
Four flow tabs on one OpexFlow instance. Two are sub-flows that the other two call: one plans the partitions, one makes a single Epicor request with retries.
Nodes in the pull flow, in order
- schedule 02:00
- plan: books x periods
- map: one per partition
- http: count
- http: all rows
- sql: upsert + control row
- The schedule fires at 02:00 (Asia/Jakarta) with a fiscal year. By hand, POST /api/ingest/schedule/epicor-gl-pull with a fiscal_year and a _schedule.previous_date.
- Read the active books from OFPA-Book and check that @odata.count equals the rows received. Make one partition for each book and fiscal period 1 to 12: 120 partitions per fiscal year with the 10 books of EPIC06.
- Fan out with a map node, one record per partition.
- Ask Epicor for the partition’s row count ($count=true, $top=1, one column). A count of 0 ends the record there.
- Fetch the partition in one request ($top=0 returns every row, as Epicor does) with the 23 columns the table keeps.
- Run one Postgres statement: upsert the rows by journal key and write a control row with the expected and the loaded row count.
GET /BaqSvc/OFPA-GLJrnDtl/Data?$filter=GLJrnDtl_FiscalYear eq 2025 and GLJrnDtl_FiscalPeriod eq 3
    and GLJrnDtl_BookID eq 'MAIN'&$count=true&$top=1&$select=GLJrnDtl_JournalNum
  -> {"@odata.count": 1251, "value": [ one row ]}

GET /BaqSvc/OFPA-GLJrnDtl/Data?$filter=<same partition>&$count=true&$top=0&$select=<23 columns>
  -> {"@odata.count": 1251, "value": [ 1,251 rows ]}
The count check lives in Postgres. The control row has CHECK (loaded_rows = expected_rows) and is written by the same statement as the journal rows. When a partition arrives short, Postgres refuses the control row and rolls back the whole statement, so a short partition leaves no rows at all. The failure is permanent, so the record is parked in Dead letters and raises the failure alert.
WITH src AS (SELECT * FROM jsonb_to_recordset(${metadata.http_response.value}::jsonb) AS x(...)),
     up AS (INSERT INTO gl_journal_detail (...) SELECT ... FROM src
            ON CONFLICT (fiscal_year, book_id, journal_code, journal_num, journal_line)
            DO UPDATE SET ... WHERE (old values) IS DISTINCT FROM (new values)
            RETURNING (xmax = 0) AS inserted),
     ctl AS (INSERT INTO epicor_partition_load
               (fiscal_year, fiscal_period, book_id, expected_rows, loaded_rows, run_id)
             VALUES (${fy}, ${period}, ${book}, ${expected}, (SELECT count(*) FROM src), ${run_id})
             ON CONFLICT (fiscal_year, fiscal_period, book_id) DO UPDATE SET ... RETURNING 1)
SELECT ... FROM up
One request, three attempts
Every Epicor call goes through one sub-flow. Its http node sends HTTP Basic and an X-API-Key header, both read from environment variables that the configuration lists, so no secret is stored in the flow. The mock accepts any one credential; the node sends both.
{
  "id": "g1", "type": "http", "method": "GET",
  "url": "${var:EPICOR_BASE}/${req.baq}/Data?$filter=${req.filter}&$count=true&$top=${req.top}&$select=${req.select}",
  "headers": { "X-API-Key": "${EPICOR_API_KEY}", "Accept": "application/json" },
  "auth": { "type": "basic", "username": "${EPICOR_USER}", "password": "${EPICOR_PASSWORD}" },
  "merge": "merge", "timeout_ms": 120000, "error_on": "all"
}
OpexFlow 2.2.0 has no retry setting on the http node, no back-off and no Retry-After handling. The sub-flow builds retries from what exists. A transient failure (429, 5xx, a timeout or a transport error, reported as stage “retry”) goes down the node’s error wire to a branch, waits one second, and tries again, up to three attempts. Any other failure (400, 401, 404) goes to the last node, which throws, so the record is parked in Dead letters and the failure alert goes out. The wait is a one second answer from a mock service that OpexFlow serves itself, because the flow has no delay node.
{
  "transform": {
    "timeout_ms": 5000, "memory_limit_mb": 128,
    "executor": {
      "http_host_allowlist": ["<proxy host>", "<wait service host>"],
      "http_env_allowlist": ["EPICOR_USER", "EPICOR_PASSWORD", "EPICOR_API_KEY"],
      "http_max_response_bytes": 67108864, "http_timeout_ms": 60000,
      "total_deadline_ms": 1800000, "max_node_steps": 200000
    }
  },
  "telemetry": { "alerts": { "on_failure": true, "window_secs": 60, "email": { "...": "local test mailbox" } } }
}
A clean load and a re-run
Five pulls, one per fiscal year recorded in the mock, into an empty database. The expected figures were counted separately, straight from the recorded file.
| Fiscal year | Rows in Postgres | Rows in the file | Partitions loaded | Run time |
|---|---|---|---|---|
| 2021 | 10,805 | 10,805 | 15 | 9.9 s |
| 2022 | 30 | 30 | 1 | 8.9 s |
| 2024 | 154 | 154 | 3 | 9.8 s |
| 2025 | 3,062 | 3,062 | 16 | 11.5 s |
| 2026 | 156 | 156 | 13 | 8.1 s |
| Total | 14,207 | 14,207 | 48 |
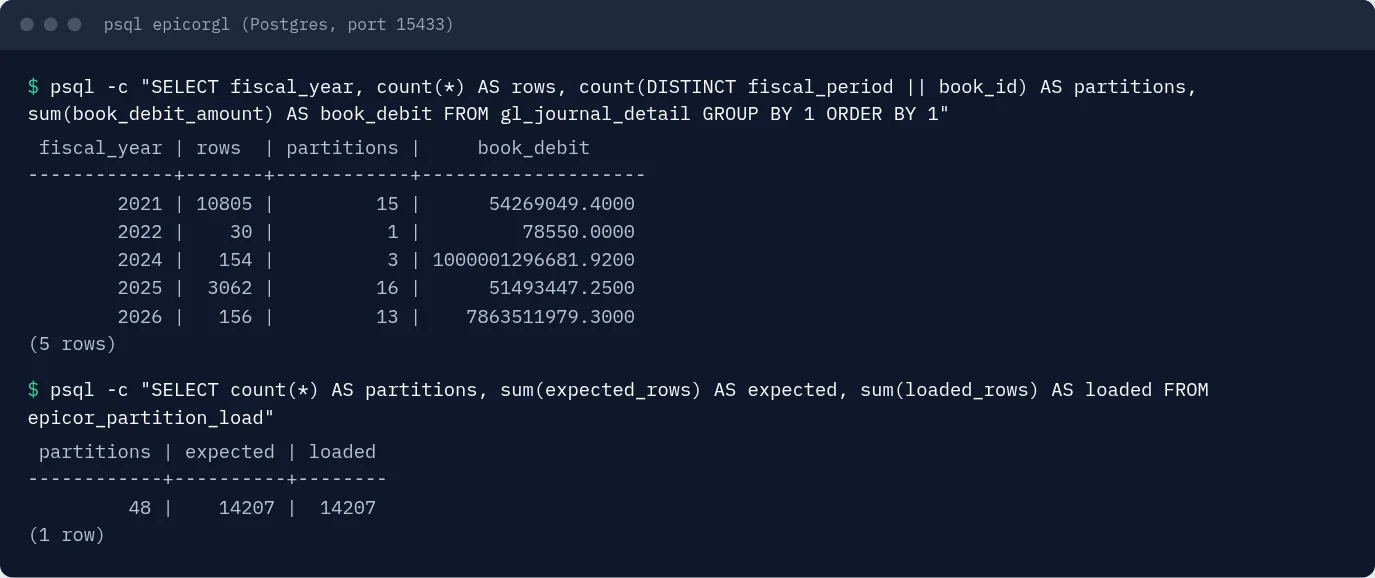
The book debit total of each fiscal year in Postgres also equals the total in the file, to the cent. Epicor was asked 653 times: 5 for the book list, 600 count requests (120 per fiscal year, most of them for empty partitions) and 48 requests for rows. The answers added up to 10.2 MB. The largest was one partition of 7,517 rows (2021, period 9, MAIN) at 5.29 MB.
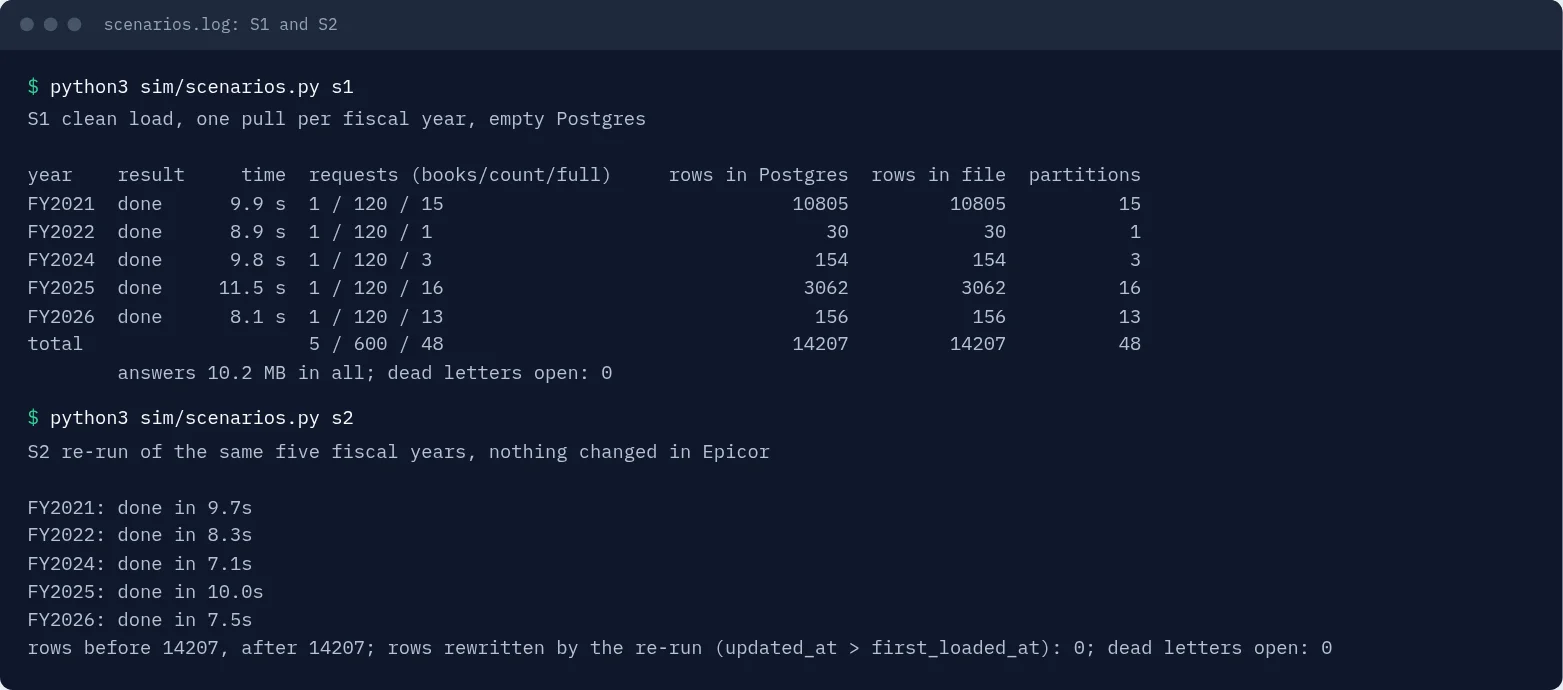
Then the same five pulls again with nothing changed in Epicor. Postgres held 14,207 rows before and 14,207 after. The upsert only touches a row whose values differ, and no row was rewritten: none has an updated_at later than its first_loaded_at. The control table shows what each partition was expected to hold and what it holds.
Retries on 429 and 503
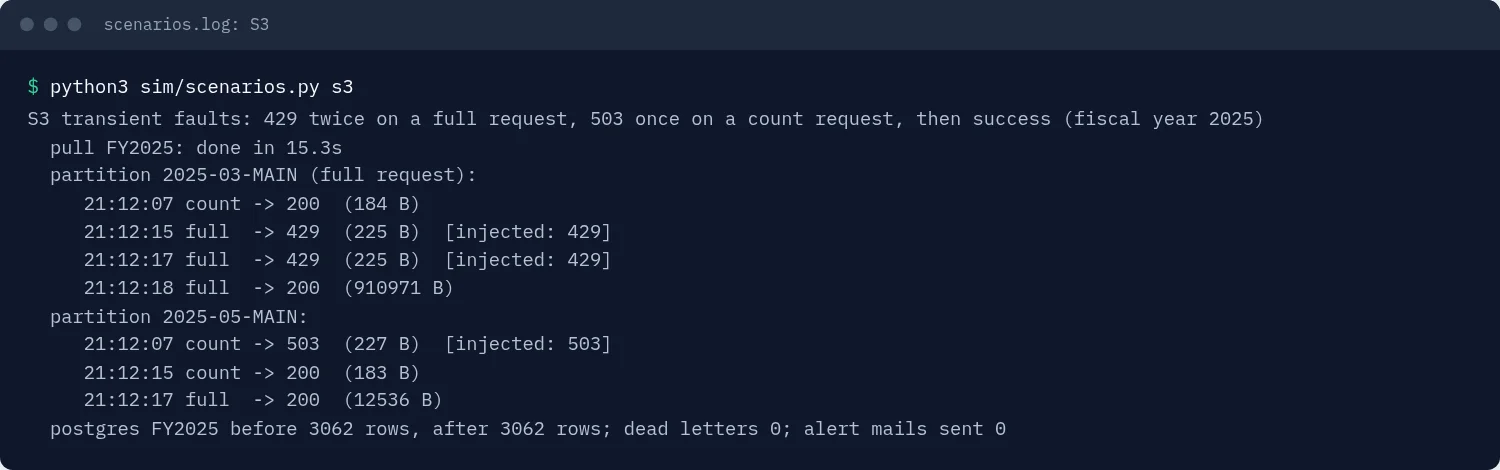
Two transient faults on fiscal year 2025, which was already loaded: the row request of period 3, MAIN answered 429 twice, and the count request of period 5, MAIN answered 503 once. Each fault is a response from the mock itself, with Epicor’s error body.
- Period 3, MAIN: 429, 429, then 200 with the rows, on the third attempt.
- Period 5, MAIN: 503, then 200 on the second attempt.
- The pull ended done in 15.3 s. Postgres still held 3,062 rows, there were no dead letters and no alert.
- A retry came 1 to 8 seconds after its failure, because the one second wait step queues behind the other work of the run.
Failures that are parked: 401, 400 and retries used up
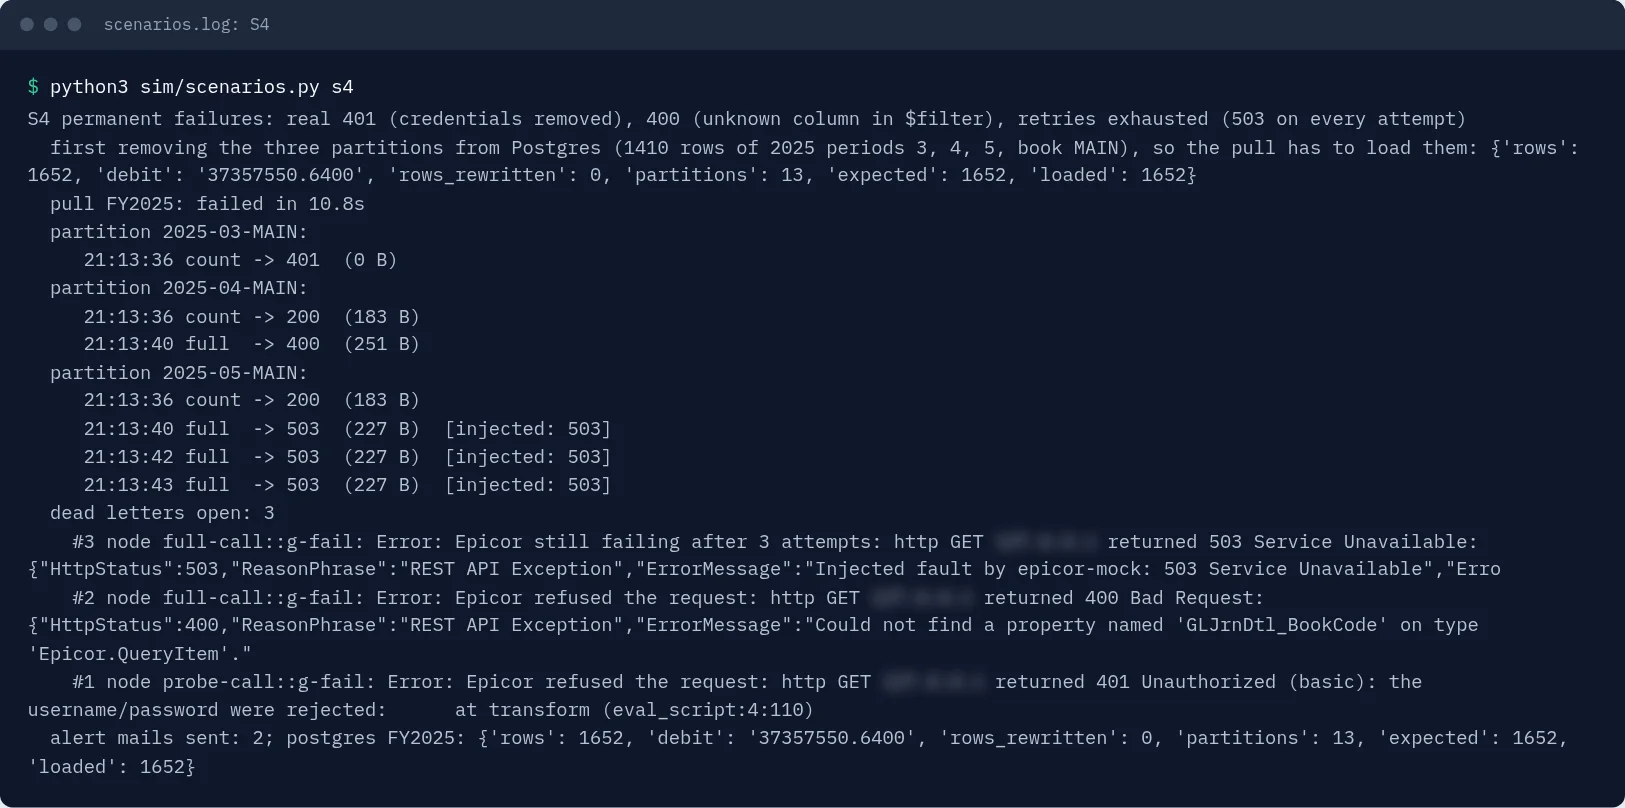
Three faults at once on three partitions of fiscal year 2025. The three partitions were first deleted from Postgres (1,410 rows), so the pull had to load them.
- Period 3, MAIN: the login was removed from the count request. The mock answered a real 401 with an empty body. One request, no retry.
- Period 4, MAIN: the filter named a column that does not exist. The mock answered 400 with Epicor’s message, “Could not find a property named ‘GLJrnDtl_BookCode’ on type ‘Epicor.QueryItem’”. One request, no retry.
- Period 5, MAIN: 503 on every attempt. Three attempts one to two seconds apart, then the record was failed.
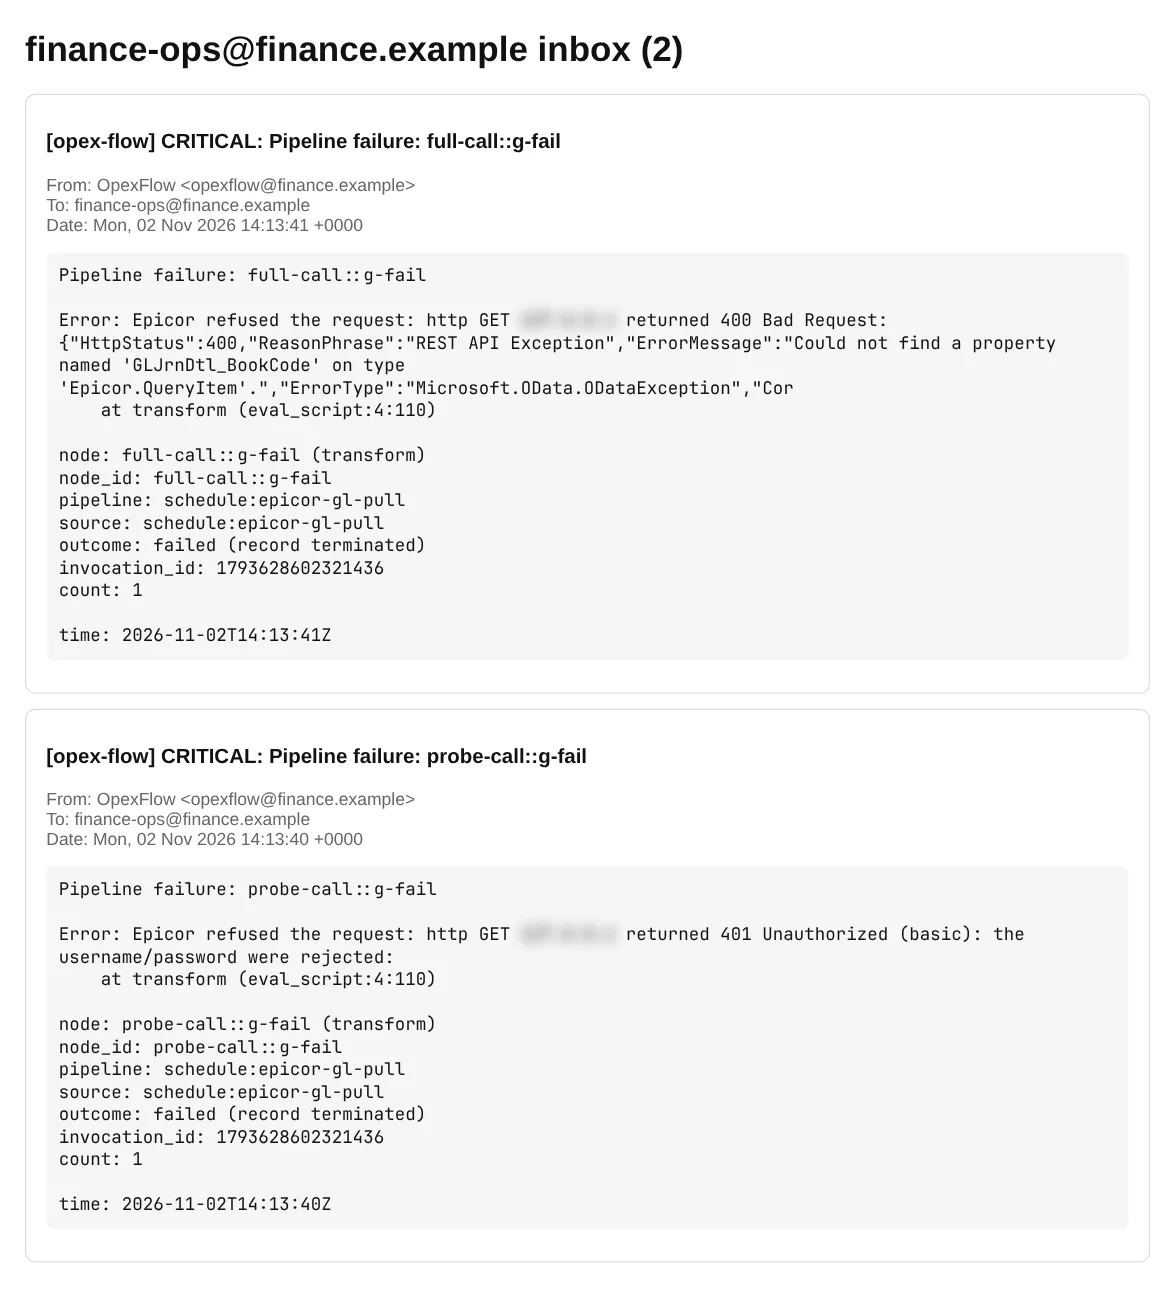
The other 13 partitions loaded and the run ended failed after 10.8 s, with 1,652 rows in Postgres: 3,062 less the 1,410 rows of the three partitions. Three dead letters were open, each holding the record the failing node received, so its request can be repeated. Two alert emails went out. The limiter sends one alert per failing node per window, and the second failure of the same node was folded into a later summary mail.
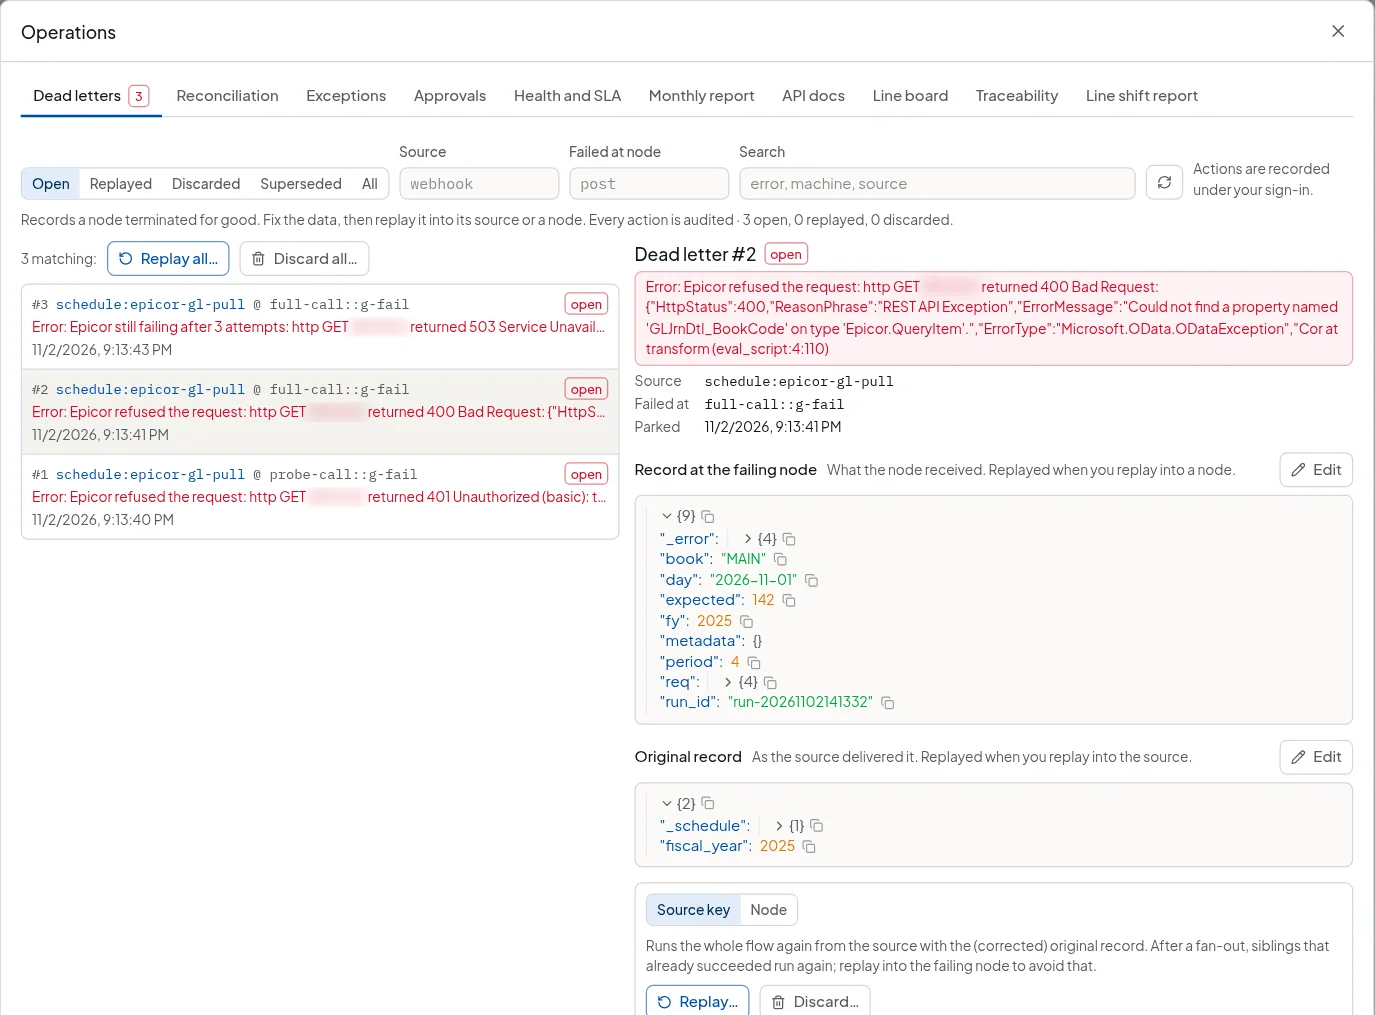
With the faults cleared, the three dead letters were replayed into the failing request node. Replaying into the source would have repeated the 13 partitions that had already finished. All three replays ended done, and Postgres was back to 3,062 rows in 16 partitions.
A short partition is refused
To provoke a short answer, a second mock instance ran with MOCK_MAX_PAGE_SIZE=1000. It cuts every answer at 1,000 rows and adds an @odata.nextLink, while @odata.count still reports the full total. Fiscal year 2021, empty in Postgres, has two partitions above 1,000 rows: period 8, MAIN with 2,008 rows and period 9, MAIN with 7,517.
Both were refused by the control row’s CHECK. The other 13 partitions loaded, 1,280 rows. The two refused partitions have no rows in Postgres, not even the first 1,000, because the statement was rolled back. The run left two dead letters and sent an alert email, followed by a summary mail for the second failure.
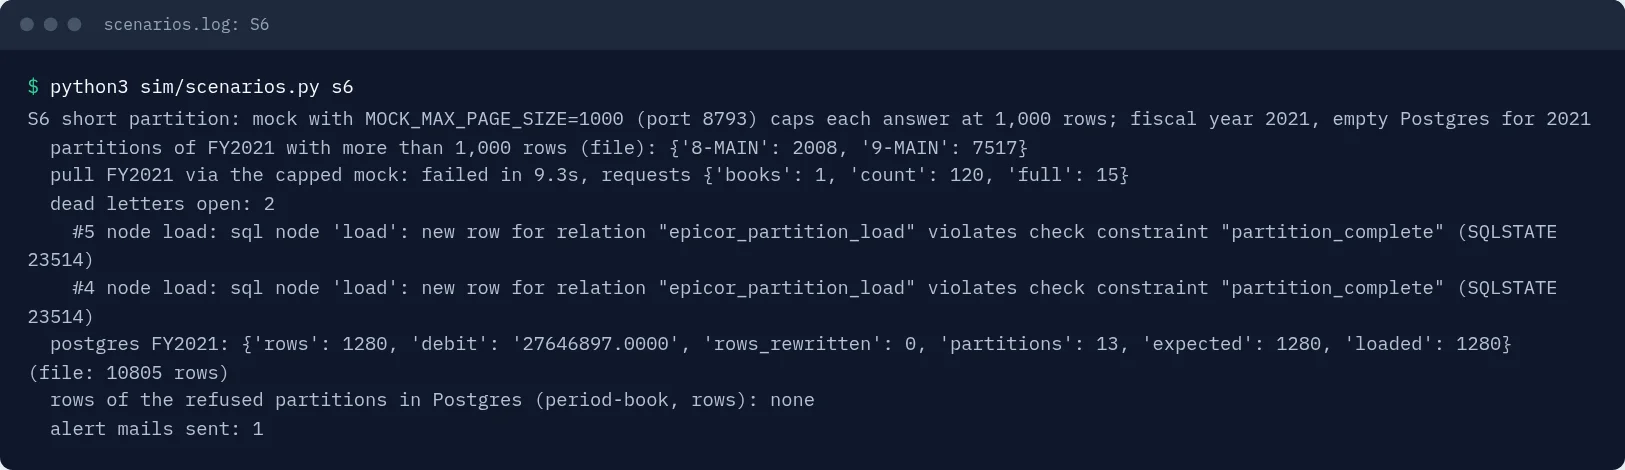
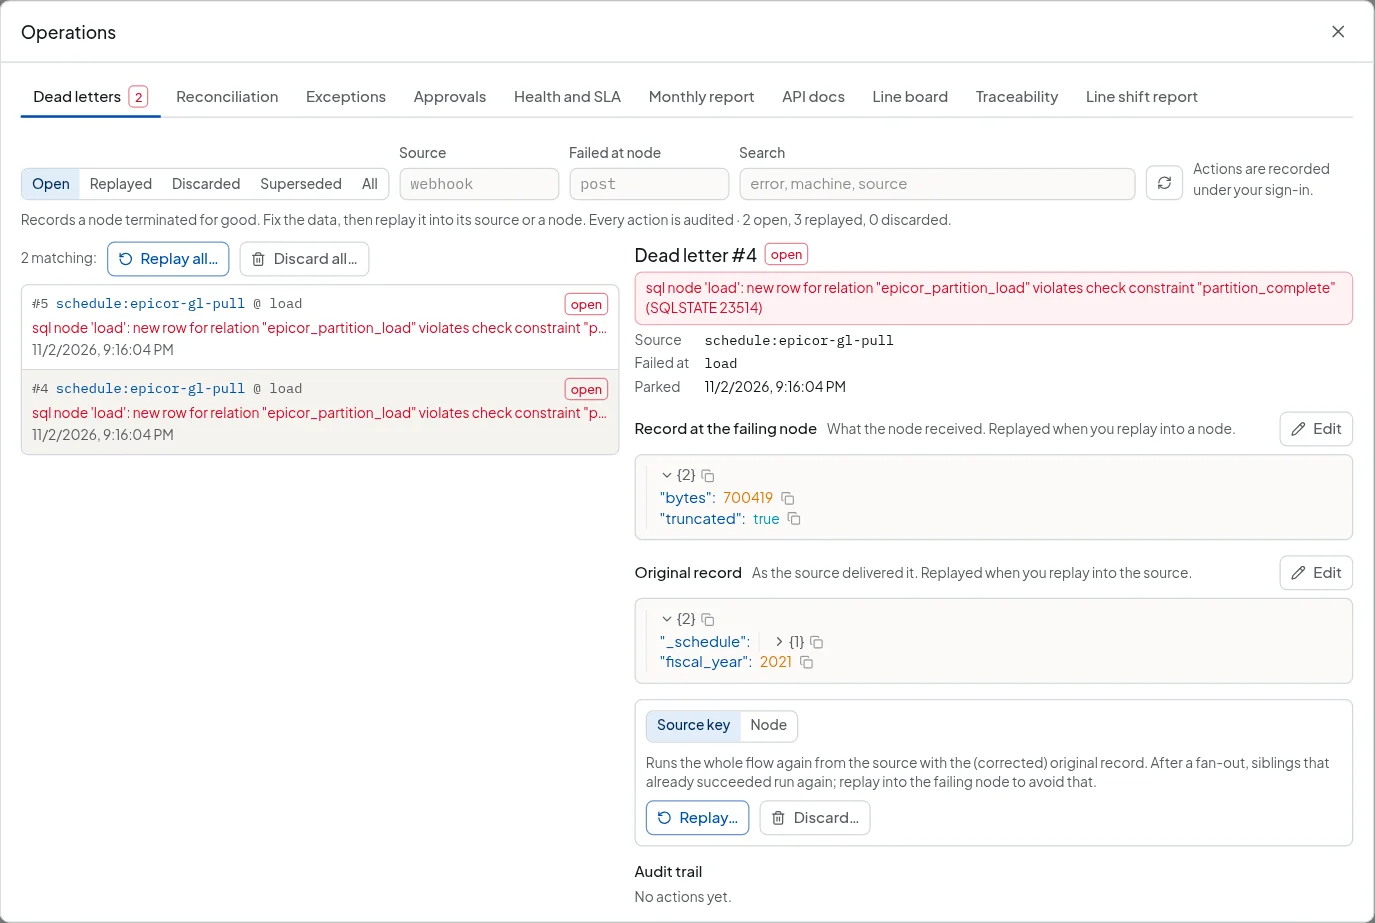
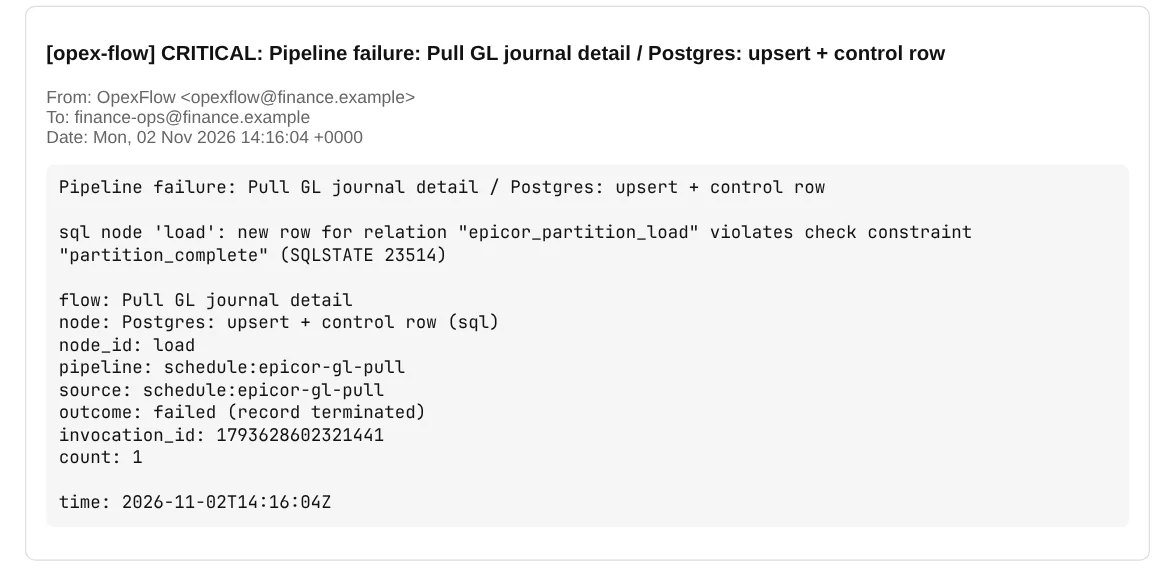
OpexFlow replaces a dead-lettered record over 256 KB with a marker, so this record, 700 KB of rows, cannot be replayed into the node. It can be replayed into the source, which re-runs the whole fiscal year and is safe because the load is idempotent. After switching back to the uncapped mock, one replay into the source loaded all 10,805 rows of fiscal year 2021 and the other dead letter was discarded.
What a failure part-way through paging looks like
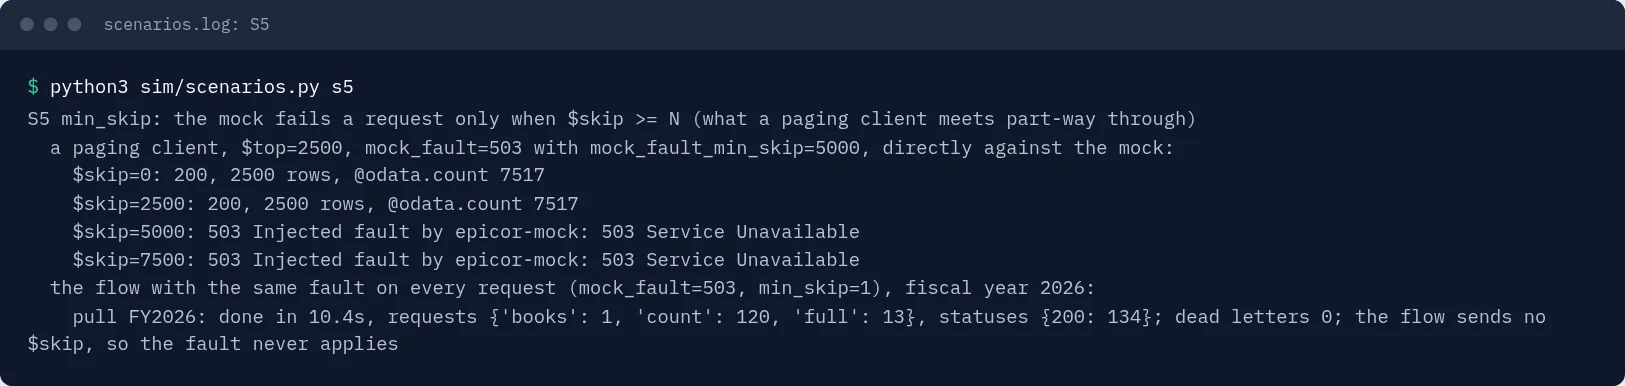
The mock can fail a request only when $skip is at or above a threshold, which is what a $top and $skip client meets in the middle of a table. Against fiscal year 2021, period 9, MAIN (7,517 rows) with $top=2500 and the fault at $skip 5,000, a paging client got 2,500 rows at $skip 0 and 2,500 at $skip 2,500, then a 503 at $skip 5,000 and at 7,500. It would hold 5,000 of 7,517 rows and have to decide what to do with them.
This flow is not a paging client. With the same fault switched on for every request, the pull of fiscal year 2026 loaded all 156 rows: 134 requests, all 200. No request carries $skip, so the fault never applied. For this flow, a failure part-way through is a failure on one partition of many, as in the sections above: the finished partitions stay, the failed one is parked, and a replay or a re-run completes the set without duplicates.
The nightly check: Epicor against Postgres
The reconcile flow runs at 02:30. It reads every partition from Epicor again (the debit and credit columns only, count-checked) and compares Epicor’s total and row count per partition with what Postgres holds. Two ledgers are tallied for each partition, one for the book debit total and one for the row count, each with an Epicor side and a Postgres side. A join node waits for every partition, then two reconcile nodes compare the sides.
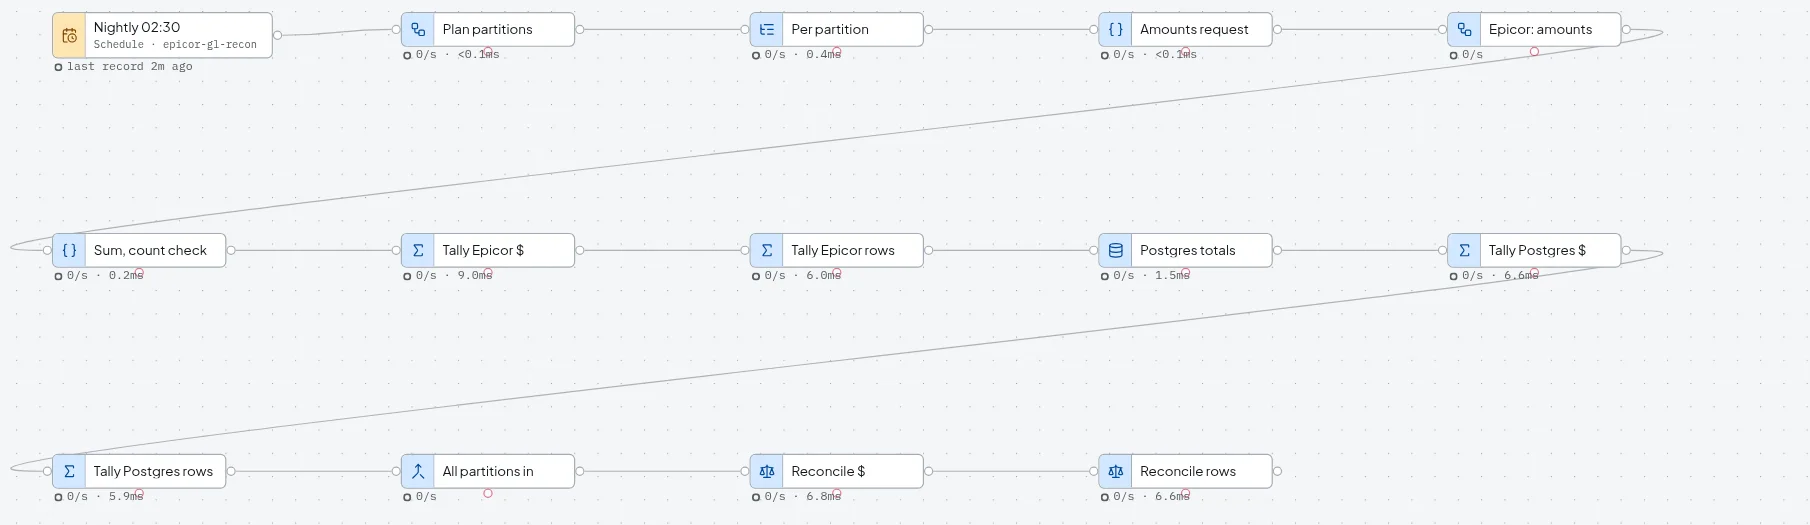
After the clean load the reconcile ran for each fiscal year. The last report compared 600 partitions on each side: 14,207 rows against 14,207, and a book debit of 1,007,970,649,707.87 against the same figure. All 600 matched and there were no exceptions. A report covers every key tallied for its day, so each run includes the earlier fiscal years: the five reports hold 120, 240, 360, 480 and 600 keys.
For the gap, three rows of fiscal year 2025, period 3, MAIN were deleted from Postgres (lines of 70, 100 and 50) and the amount of one line in period 5 was raised by 250. The reconcile for 2025 then found the following.
| Report | Partition | Epicor | Postgres | Difference |
|---|---|---|---|---|
| Book debit | 2025-3-MAIN | 12,121,837.62 | 12,121,617.62 | -220 |
| Book debit | 2025-5-MAIN | 1,596 | 1,846 | 250 |
| Row count | 2025-3-MAIN | 1,251 | 1,248 | -3 |
The debit report matched 118 of 120 partitions. The fiscal year total was 51,493,447.25 in Epicor and 51,493,477.25 in Postgres. Both reports were sent by email through the alert channel, and three exception cases opened with 473 at stake.
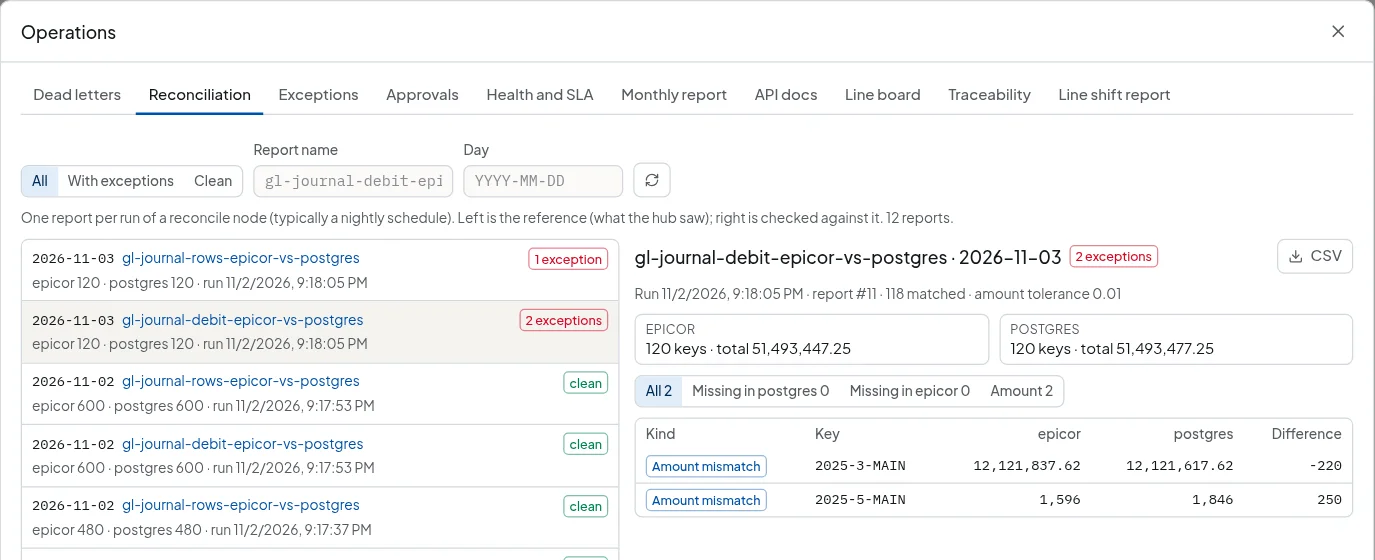
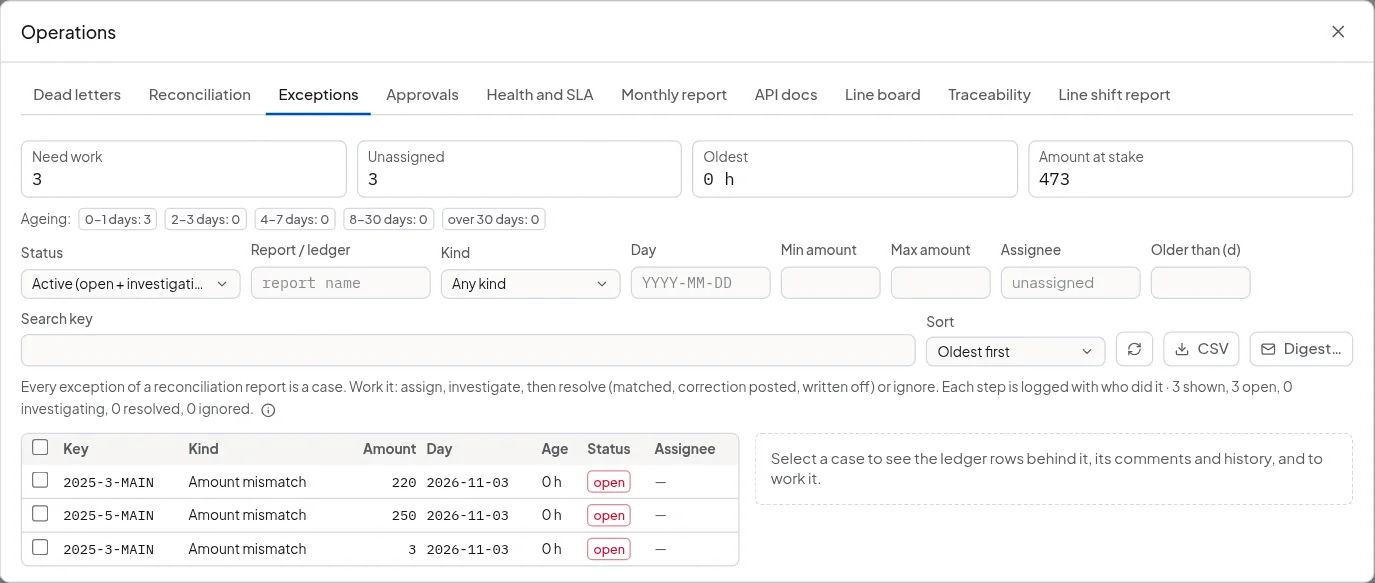
Pulling fiscal year 2025 again restored the three rows and corrected the changed amount: the upsert rewrote exactly one row. The reconcile for the same day then matched all 120 partitions with no exceptions, and the three cases closed on their own.
Health and alerts
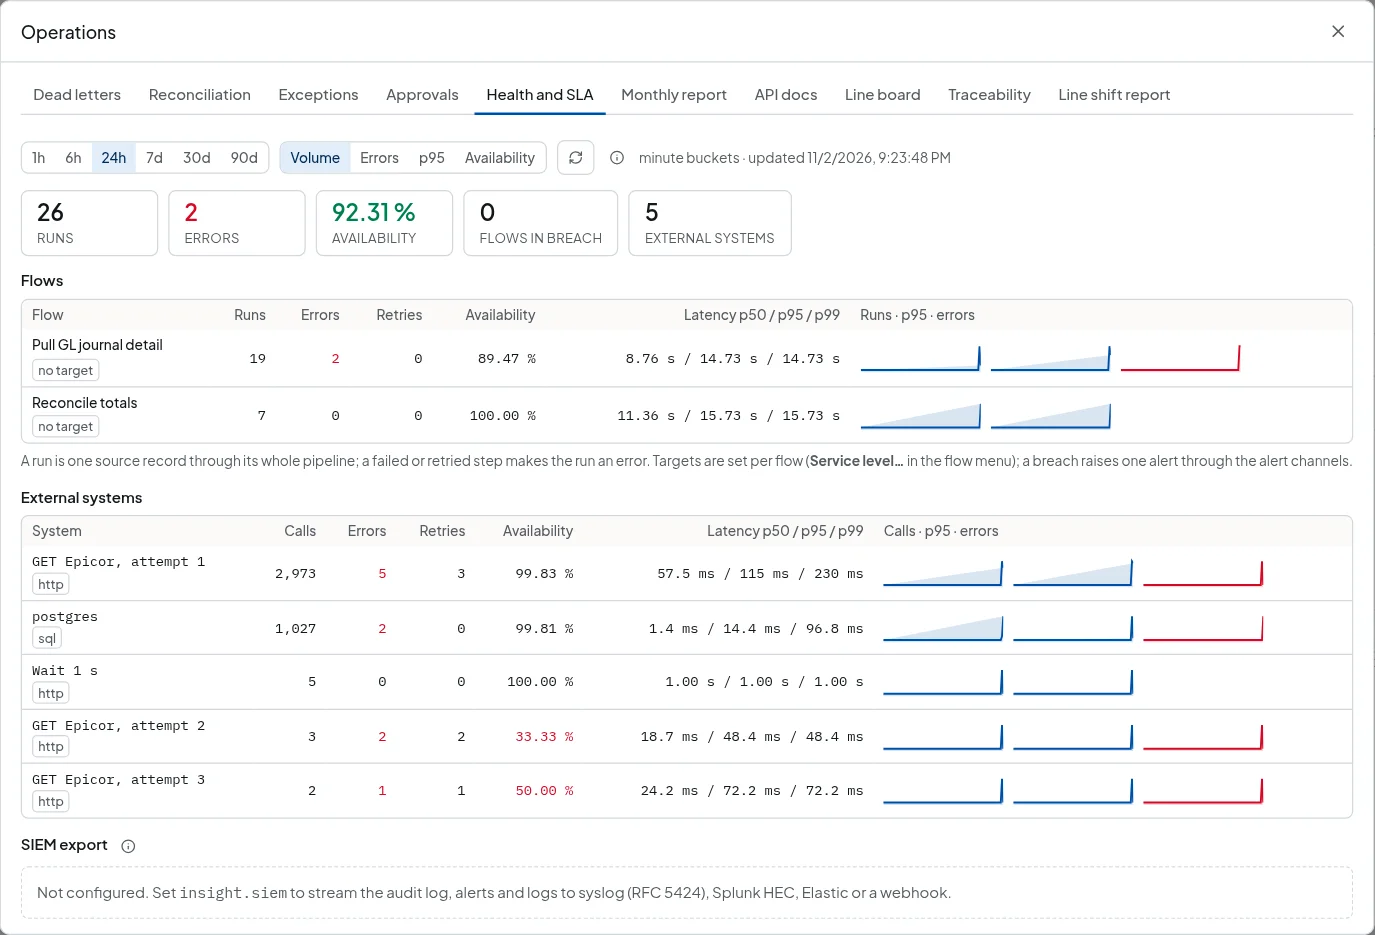
The Health and SLA tab shows the retries as the flow lived them. Over the whole test there were 26 runs and 2 errors, the two pulls that ended with parked records. First attempts to Epicor: 2,973 calls, 5 errors, 3 retries. Second attempts: 3 calls, 2 retries. Third attempts: 2 calls, 1 retry that ended as a failure. The wait step ran 5 times. Postgres: 1,027 statements, 2 errors, the two refused partitions.
Where OpexFlow 2.2.0 fell short
| Gap | Workaround used |
|---|---|
| The http node has no retry setting, back-off or Retry-After handling. | Three attempts chained over error wires with a one second wait. The wait is a call to a mock service served by OpexFlow itself, because there is no delay node. Retry-After is ignored. |
| error_on routes either every failure or only permanent ones to the error wire. It cannot send transient failures to the wire and leave permanent ones for Dead letters. | All failures go to the wire. A branch on the error stage sends transient ones back for another attempt, and a final node throws for the rest, which parks them. |
| No loop or paging node. | The partitions are planned up front and fanned out with a map node, which suits the one-request-per-partition rule. |
| The deploy check of worst-case node steps (map size times nodes, counting every copy of a sub-flow) was 136,828 for a first draft against a limit of 10,000. | max_node_steps raised to 200,000 and the map capped at 240 partitions. |
| A scheduled tick is not retried. A failed partition ends the run as failed, while the other partitions finish. | Replay the dead letter into the failing node, or trigger the schedule again. Both are safe because the load is an upsert. |
| A key such as @odata.count cannot be read by a dot path, because its name contains a dot. | A small JavaScript transform reads it, on the count answer, which is one row. The large answer is never passed through a script. |
| A dead-lettered record over 256 KB is replaced by a marker and cannot be replayed into a node. | Replay the dead letter into the source, which re-runs the fiscal year. |
| Alerts and errors inside a sub-flow name nodes by id (full-call::g-fail), not by label. | None. The ids are readable once the flow is known. |
| A reconcile compares one amount per key. | A second ledger and reconcile pair for row counts. |
| The editor warns “no path to any sink” for the node that fails the record on purpose. | Ignored. It is a deliberate dead end. |
Scope
- Epicor was a mock replaying recorded EPIC06 responses. The loss from unordered $top and $skip paging was measured earlier on a real Epicor test server, 12 of 17,160 trial balance rows, and was not reproduced here: the mock’s row order is stable.
- Faults were produced with the mock’s own options through a small proxy. The 401 came from removing the credentials and the 400 from renaming a column in the filter.
- Only the journal detail BAQ was pulled, 14,207 rows. The same pattern fits the trial balance (95,818 recorded rows), which was not run.
- Twelve periods per fiscal year were assumed. A fiscal calendar with 13 periods needs a longer period list.
- The reconcile compares totals and row counts per partition, not rows. Two errors that cancel inside one partition would pass.
- Run times of 8 to 12 seconds per fiscal year are from one machine against a local mock. A real server will differ.
- The schedules were triggered by hand with POST /api/ingest/schedule/{name}. A scheduled tick that is missed is not replayed.
- The master key was not set, so dead letters were stored unencrypted. They hold ledger rows: set OPEX_MASTER_KEY or encrypt the disk.
- The alert emails went to a local test mailbox.